Know why production broke.
Open-source AI root cause analysis. SerOps reads the logs, metrics, traces, deployments and code changes you already have, and tells you why an incident happened, even when no alert fired.
Or run it yourself, in about 10 minutes:
$ git clone https://github.com/getserops/serops$ cd serops/deploy/quick-start$ cp .env.example .env# then set the three secrets in .env$ docker compose up -d
No signup. No credit card. Logs and code stay on your infrastructure: SerOps reads only the diffs of recent commits, and only redacted context goes to the AI provider you choose.
Works with the stack you already run
Nothing to migrate and no agent to replace. Connect your existing tools from the UI.
Metrics
Notifications out
Which setups have been validated end to end? See tested environments →
From raw signals to a root cause
SerOps sits on top of your observability stack. It does not store your logs; it reads them when it needs them.
- 01
Connect
Point SerOps at your log, metric and trace backends, your repositories and your CI/CD. Credentials are encrypted in your own database.
- 02
Correlate
On a schedule you set (every 15 minutes by default) and whenever an alert comes in, SerOps groups new signals per project and environment, collapses duplicate errors and lines them up with recent deployments.
- 03
Explain
When something changed, the AI model you chose gets the redacted context and returns a root cause, the evidence behind it and a recommended fix. Quiet windows skip the AI call entirely.
Built for the questions that come after the alert
Every feature below ships in the open-source release. No paywall, no lite tier.
Works without alerts
SerOps looks at the signals themselves, so it surfaces problems nobody wrote an alert for. Already have alerts? Send them in and they join the analysis.
Knows what you deployed
Incidents are matched to when code reached each environment, not just when it was committed, so a slow rollout still points at the right change.
Kubernetes-aware
Understands pods, restarts and OOMKills, and aggregates metrics per service so pods moving between nodes don't break the picture. Works on plain VMs too.
Learns from past incidents
Resolved issues become precedent: SerOps suggests similar past incidents and how they were fixed, and drafts a post-mortem you can edit.
Your model, your key
Claude, Gemini, OpenAI, DeepSeek, or a local model through Ollama for fully on-premises analysis. Your provider bills you directly; set a monthly budget per organisation.
AI spend under control
A sentinel skips the AI call when nothing changed, a thousand identical errors collapse into one line with a count, and the stable part of the prompt is cached by the provider.
Also included
- AI chat on your incidents
- Routing rules, escalation and quiet hours
- Roles, OpenID Connect SSO and audit log
- Multi-cluster and multi-region deployments
- Data retention controls
- Prometheus metrics for SerOps itself
See it on real data
Screenshots from the live demo. The same product you self-host.
Opens on what is broken now
The dashboard leads with the most severe open issue: why it is happening, what to do, and one click to the issue, the analysis or an investigation of that window.
Explore the live demo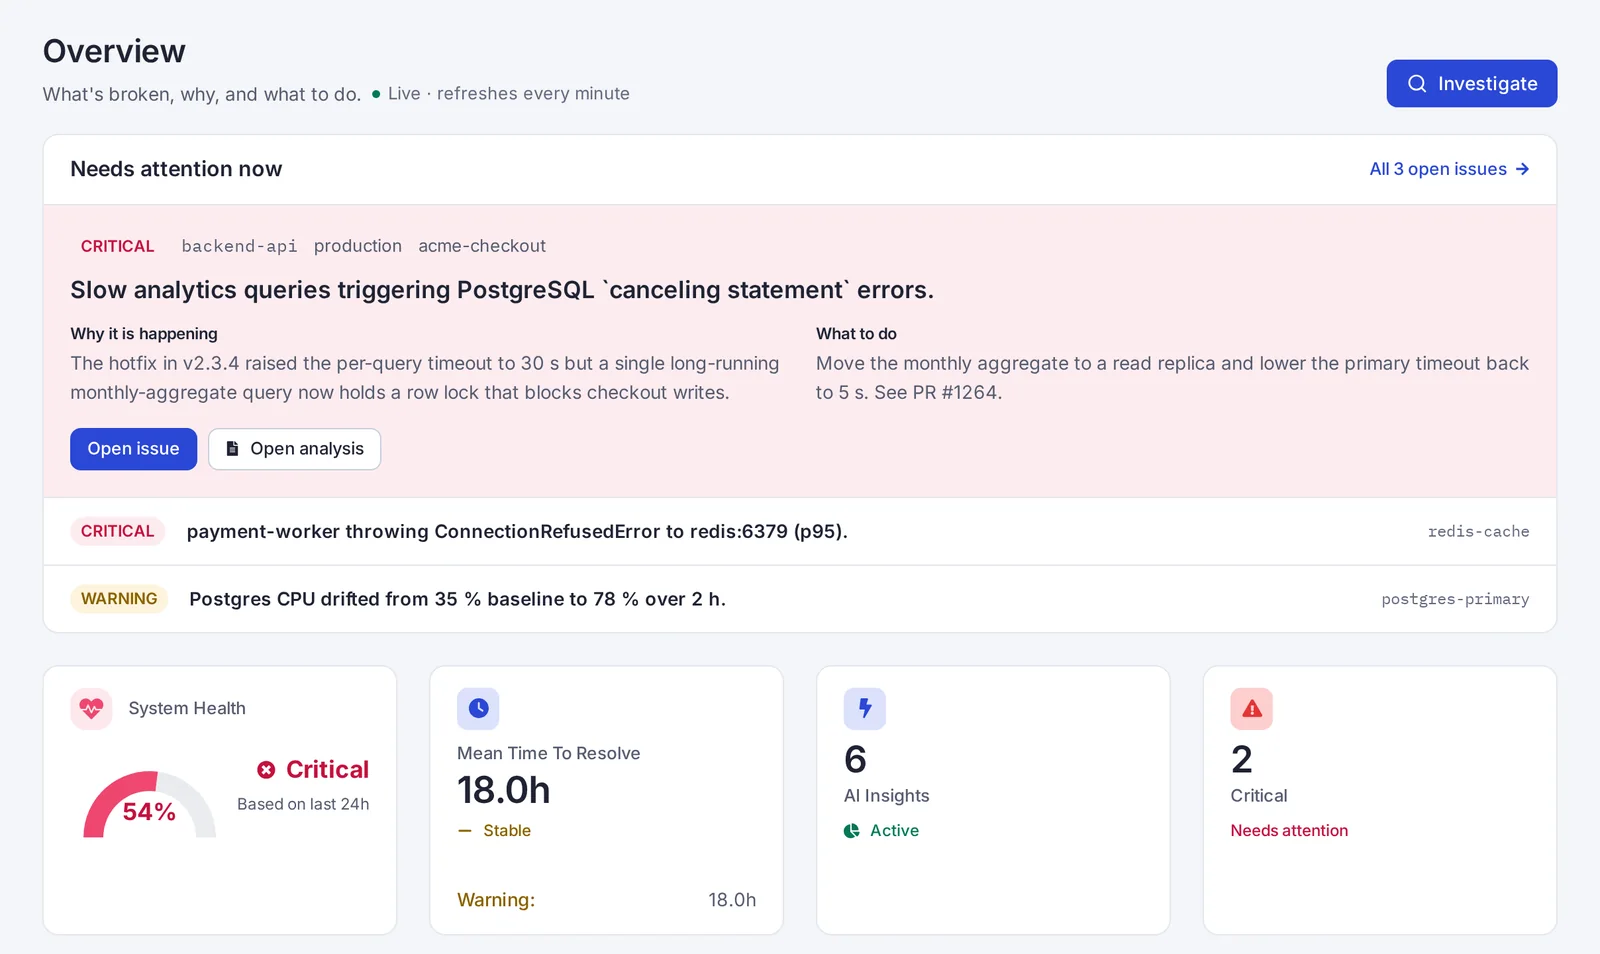
Your data. Your infrastructure. Your keys.
SerOps runs where you deploy it. It queries your providers with credentials you supply, and AI calls go to the provider you choose, with your key. SerOps sends nothing back to us.
Redaction before AI
Passwords, API keys, tokens and email addresses are masked before any context is sent to an AI provider.
Any model, including local
Switch providers per organisation to balance cost and reasoning. Use Ollama to keep everything on your own hardware.
- AGPL-3.0: every feature, no lite tier
- Never clones or indexes your repository
- Postgres and Redis, nothing else to run
- Docker Compose or Helm
Frequently asked questions
Comparing tools? SerOps vs Datadog Bits AI SRE · SerOps vs Causely · SerOps vs K8sGPT · SerOps vs HolmesGPT · SerOps vs Coroot
Try it now, or run it yourself
Explore a fully populated demo organisation, or clone the repository and have SerOps running on your own machine.
What you get
- Every feature: no paid tier, no lite mode
- Every integration
- Unlimited users, projects and services
- Runs on a laptop, a VPC, on-premises or air-gapped
What you don't need
- No signup, no credit card
- No data sent to us
- No lock-in: AGPL-3.0, fork it any time
- No sales call